For a webmaster or business that relays on it's online presence, there is nothing worse than a slow loading web site.
Slow loading web site could drive your visitors and potential customers and profits away.
Unoptimised web sites are often ranked lower in the Search Engine results.
But how slow is actually slow? How fast is fast? How to measure that and how does your web site compare to others?
Let's find out!
Before we start, we need to make sure we are using proper hosting provider and that the server's response time is decent.
WebSitePulse provides you with a tool, that will help you to determine that:

Click here to open the tool in your browser, then enter your web site's URL address in the Enter Test Website field, Select Location that is closest to the server hosting your web site and click Perform Test.
What you should be looking at is:
Response Time - This is the amount of time that it takes for the server to send a response to the testing location. This variable may be impacted by the distance between the virtual visitor and address of the web site. Lower is better. Anything under 0.5 seconds is acceptable.
DNS time - How long it takes to reach the Domain Name System and set the time to live. This helps to ensure that data packets are not cycled indefinitely on the network. Lower is better. Anything under 0.2 seconds is acceptable.
Connect - The length of time needed to connect to the website session. Lower is better. Anything under 0.1 seconds is acceptable.
First byte - The length of time it takes the browser to access the first byte of web site resources being queried. Lower is better. Anything under 0.1 seconds is acceptable.
Keep in mind that your web site’s speed may vary. We recommend running between 5 and 10 scans of the same web site to establish a data set that provides the most accurate average speeds.
Is your web host letting you down? Escape to Kualo and get six months of free hosting!
There are 3 tools, that will help you to precisely measure the loading time of your web site as well as understand which element is taking much time to load.
The most commonly used tool for testing a web site's performance is called GTMetrix:

It will provide you information about the Page Load Time, Total Page Size, Requests, as well as recommendation how to optimise these and improve your score and loading time in general.
When analysing the performance of your web site, it is important to select the following from the Analysis Options:
- Test URL in - server, that is closest to the one hosting your web site
- using - Firefox (Desktop) or Chrome (Desktop)
- with - Unthrottled Connection.
If your web site loads in 1 - 2 seconds, then you are in the fast loading zone.
Web sites that take more than 8 seconds to load, are considered extremely slow.
For web applications, such as WordPress, Joomla, Magento and Moodle, a loading time of 4 - 5 seconds is considered as normal.
You can compare your web site with the "Top 1,000 sites on the internet according to Google" here.
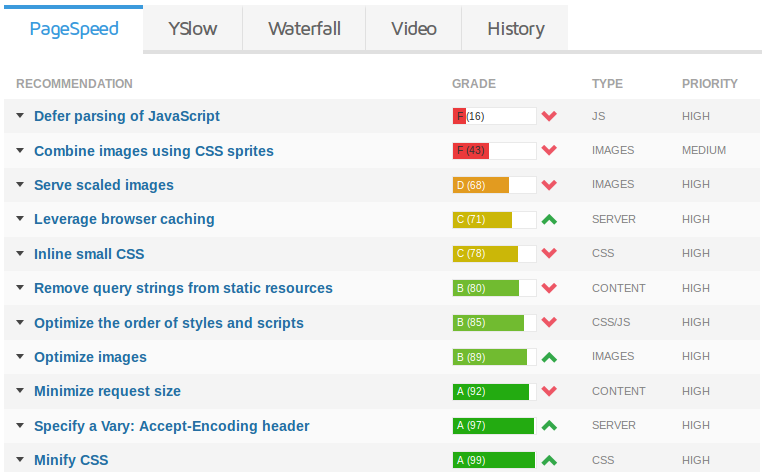
The PageSpeed, YSlow, Waterfall and Video sections will provide you recommendations about the aspects of your web site you should optimise, the current Grade and the Priority (effect it has on the loading time of your web site):

The History tab will give you access to the older, archived reports so you could compare your progress.
The Pingdom Website Speed Test tool is the next tool you could use to analyse your web site and find it bottlenecks:

Pingdom will help you to identify which areas of your web site are slow or too big, as well as provide you tips about the best optimisation practices you are not following.
Similar tool as the GTMetrix, it provides you information about the Load Time, Page size and Requests generated during the loading of your web site, sorted by load order in a Waterfall type view.
Pingdom will also warn you about broken links on your web site:
You should reconnect the broken links or remove them, as this will significantly improve your web site's load time.
The third tool you can use to analyse your web site, is the Google's PageSpeed Insights tool.

It is similar to GTMetrix and Pingdom, however it will also analyses the mobile version of your web site and provide you appropriate recommendations, related to the font type and font size you are using and if the viewport is properly configured.
Google provides great documentation about the Speed Rules and Best Practices that could help you optimise your web site.
If you have analysed your web site with the tools above, you have most probably already noticed some of the most common issues that could lead to a slow loading web site:
- Broken links - having your web site continuously trying and failing to fetch a file from another server could lead to a huge delay in opening the pages.
- Unoptimised images - optimising the images will lead to the largest byte savings and performance improvements for your web site.
- Unoptimised CSS and JavaScript - minifying the CSS and JavaScript will help you to reduce the file size and make the web site load faster.
You could also combine CSS files in one big file. It will load a lot faster than several small CSS files, as more files means more requests to the server.
The same applies to the JavaScript files.
There are few additional tips that will help you to optimise your web site even further:
- Are you running PHP based web site? Switch to PHP 7!
PHP 7 with OpCache is available on our servers!
- Use CDN (Content Delivery Network) to serve your static content.
This is possible by caching your web site’s content across many data centres around the world.
As a CloudFlare Optimised Partner, we are thrilled to offer the CloudFlare Railgun™ technology to all our customers absolutely free of charge.
Railgun is typically only included with CloudFlare’s $200/mo paid package.
- Periodically Check, Repair and Optimise your web site's database.
- Big web sites demand big web hosting solutions.
If you have any additional questions or require further clarification, please, do not hesitate to contact us.


